Overview of the Bahrain Stock Exchange (Bahrain Bourse)
A comprehensive overview of the Bahrain Stock Exchange (Bahrain Bourse), analyzing its market structure, regulation, liquidity characteristi...
Stock prices look deceptively simple on trading platforms. A number flashes on the screen, sometimes green, sometimes red, accompanied by a percentage change that seems to summarize everything an investor needs to know. This visual simplicity is one of the most dangerous aspects of modern investing. Prices and quotes are not objective truths; they are representations shaped by market structure, liquidity, data sources, and platform design decisions. Misunderstanding how those numbers are formed leads investors to misjudge risk, execution quality, and even portfolio performance.
The common assumption is that a displayed price is “the price” of a stock. In reality, it is almost always a reference point rather than a tradable guarantee. Behind that number sits a constantly changing order book, fragmented across venues, influenced by latency, liquidity providers, and regulatory constraints. What an investor sees is a snapshot, not the market itself. Treating it as final rather than indicative is a structural error that compounds over time.
For investors operating from the GCC, this misunderstanding carries additional implications. Many platforms used in the region aggregate data from international exchanges, apply currency conversions under dollar-pegged systems, and route orders through intermediaries subject to global liquidity conditions. The displayed quote may reflect US market dynamics, regional trading hours, or delayed feeds depending on the platform and account type. Assuming uniformity across platforms is therefore incorrect.
This article examines how stock platforms display prices and quotes, not from a user-interface perspective, but from a structural one. The objective is to explain what those numbers actually represent, why they differ across platforms, and how investors in the GCC should interpret them to make informed decisions. This is not about learning definitions. It is about understanding the mechanics that separate perception from execution.
A displayed stock price is not a single truth. It is usually the last traded price, meaning the most recent transaction executed on a specific exchange or consolidated feed. This price tells you where two counterparties agreed to trade in the past, not where you can necessarily trade now.
Between trades, markets are defined by bids and asks. The bid reflects the highest price a buyer is willing to pay; the ask reflects the lowest price a seller is willing to accept. The true market exists in this spread, not at the last traded price. Platforms often emphasize the last price because it is simple and visually intuitive, even though it is the least actionable data point for execution.
This distinction matters because liquidity is not constant. In highly liquid stocks, the spread is narrow and the last price is usually close to executable levels. In less liquid stocks, or during volatile periods, the spread can widen significantly. The displayed price may be several ticks away from where an order will actually fill.
For GCC investors trading international equities, time zones and session overlaps add complexity. A price displayed outside the primary exchange’s trading hours may reflect stale data, indicative pricing, or synthetic quotes generated by the platform. Understanding which of these applies is essential to avoid execution surprises.
Most platforms display bid and ask prices alongside the last traded price. While this appears to offer precision, it often creates false confidence. Bid and ask quotes are only as meaningful as the depth behind them. A narrow spread with minimal size provides little protection for larger orders.
Depth of market data reveals how many shares are available at each price level, but many retail platforms either limit this information or abstract it away entirely. Investors see the best bid and ask without visibility into how fragile those prices may be. When an order exceeds available liquidity at the top of the book, it moves the price.
This is particularly relevant for GCC investors using international platforms that route orders to US exchanges. Liquidity conditions can change rapidly during macro announcements, earnings releases, or energy-related news. A bid that appears firm seconds earlier may vanish when an order arrives.
The illusion of precision arises when investors assume displayed quotes are commitments. In reality, they are invitations, subject to change the moment they are acted upon. Platforms are designed to feel deterministic; markets are not.
Not all market data is equal. Trading platforms rely on data feeds that vary in speed, completeness, and cost. Real-time consolidated feeds are expensive, while delayed or limited feeds are cheaper and often used by default for retail accounts.
A delayed feed may show prices that are 15 minutes old, which is functionally irrelevant for execution. Even so-called “real-time” feeds may aggregate trades rather than display the full order book. The difference is rarely made explicit to users.
For GCC investors, platform choice matters because many brokers offer international access through intermediaries. Data may be sourced from third-party vendors, converted across currencies, and displayed with slight delays. These frictions are invisible unless actively investigated.
The key point is that prices are mediated. What appears on the screen is filtered through infrastructure decisions made by exchanges, data providers, and platform developers. Treating it as raw reality is a mistake.
Currency adds another layer of complexity for GCC investors. While local currencies are pegged to the US dollar, stock prices may still be displayed in USD, local currency equivalents, or both. Conversion rates applied by platforms may not match interbank rates exactly.
This discrepancy affects perceived performance. A stock may appear to have moved a certain percentage in local terms due to minor currency adjustments rather than underlying price changes. Over time, these differences accumulate and distort return attribution.
Additionally, some platforms display prices in the stock’s native currency but settle trades in USD or local currency. Understanding this distinction is essential for accurate portfolio tracking and risk assessment.
Price is never just a number. It is a function of currency, timing, and conversion methodology. GCC investors who ignore this dimension misunderstand their true exposure.
It is common for the same stock to show slightly different prices across platforms. This is not necessarily an error. Differences arise from data feed sources, update frequencies, and the specific exchanges or venues included in the platform’s aggregation.
Some platforms prioritize speed over completeness, showing the fastest available quote. Others prioritize consolidation, showing an average or reference price across venues. Neither approach is inherently superior; they serve different purposes.
For execution, what matters is not which price looks best, but which price is actionable. A slightly worse price that reflects real liquidity is preferable to an attractive quote that cannot be filled.
GCC investors using multiple platforms should resist the temptation to chase displayed prices. Consistency of execution matters more than cosmetic differences in quotes.
The ultimate test of a price is execution. Many investors discover too late that the displayed quote had little relation to their fill price. This gap is not a failure of the platform; it is a feature of market structure.
Market orders prioritize execution certainty over price, often filling at worse-than-expected levels during volatile periods. Limit orders prioritize price but risk non-execution. Understanding how quotes relate to these order types is critical.
For GCC investors trading global markets, execution risk is amplified during periods of low liquidity or overlapping macro events. Prices may gap, spreads may widen, and fills may occur far from expectations.
Platforms display prices to facilitate decisions, not to guarantee outcomes. Execution quality depends on routing, liquidity, and timing, none of which are fully visible on the screen.
Experienced investors treat prices as signals rather than promises. They understand that quotes reflect probabilities, not certainties. This mindset changes how platforms are used.
Instead of fixating on precise numbers, investors focus on ranges, liquidity conditions, and execution context. They ask whether a price is stable, whether volume supports it, and whether the market environment is conducive to trading.
For GCC investors, this approach aligns with long-term capital preservation. Misinterpreting prices leads to overtrading, poor fills, and unnecessary drawdowns. Viewing prices as indicative rather than definitive reduces friction and improves outcomes.
The platform is a window, not the market itself. Understanding what that window shows—and what it hides—is essential.
Stock platforms display prices and quotes in a way that prioritizes usability over completeness. This design choice is understandable, but it creates dangerous assumptions. Prices are not facts; they are representations shaped by data feeds, liquidity, currency, and market structure.
For GCC investors, these dynamics are compounded by international access, dollar pegs, and global execution pathways. A price on the screen may reflect a different market reality than the one an order will encounter.
The solution is not to distrust platforms, but to understand their limitations. Interpreting prices as reference points rather than guarantees transforms how investors approach execution, risk, and portfolio management.
In the long run, success in stock investing depends not on reacting to numbers, but on understanding what those numbers actually mean. Prices tell a story, but only to those who know how to read between the lines.
No. It usually reflects the last traded price, not a guaranteed executable level. Actual execution depends on current bids, asks, and available liquidity.
Differences arise from data feed sources, update speeds, aggregation methods, and currency conversion practices.
No. Real-time data reduces latency but does not guarantee liquidity or stable prices during volatile conditions.
They should view quotes as indicative signals shaped by global market structure, currency dynamics, and liquidity rather than as fixed promises.
Disclaimer: This content is for education only and is not investment advice.

A comprehensive overview of the Bahrain Stock Exchange (Bahrain Bourse), analyzing its market structure, regulation, liquidity characteristi...

An in-depth analysis of the Kuwait Stock Exchange (Boursa Kuwait), explaining its structure, regulation, market behavior, and strategic rele...

A senior-level analysis explaining when stocks make more sense than diversified asset trading, focusing on correlation risk, time horizons, ...
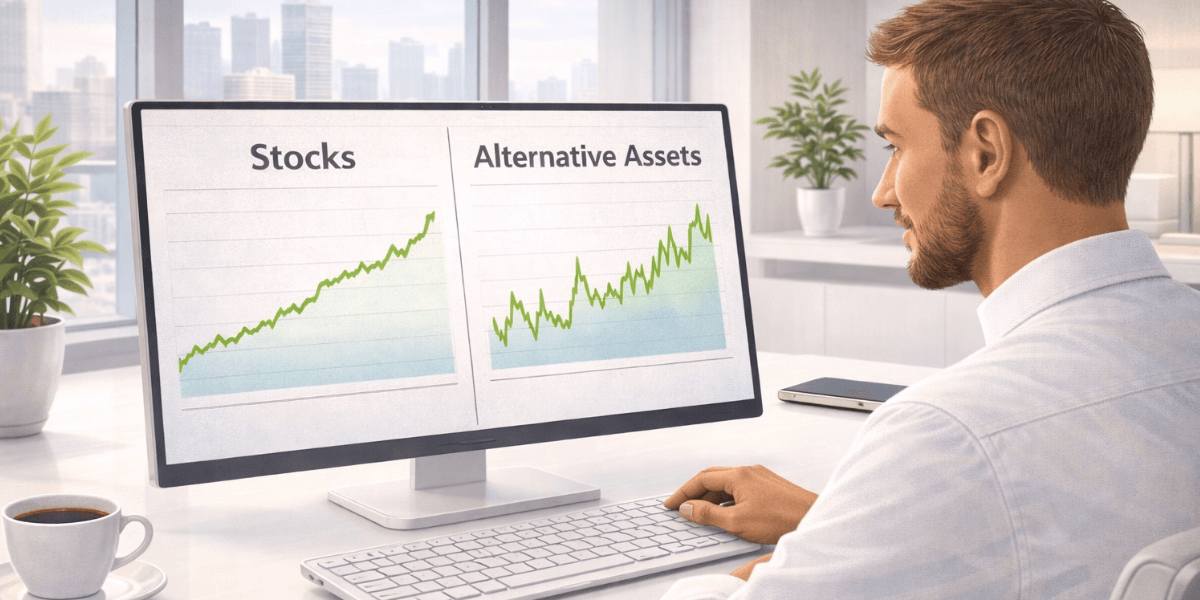
A senior-level analysis comparing stocks and alternative assets from a conservative investing perspective, explaining capital durability, tr...

A senior-level analysis explaining why stocks are fundamentally easier to analyze than other assets, focusing on cash flows, accounting stru...
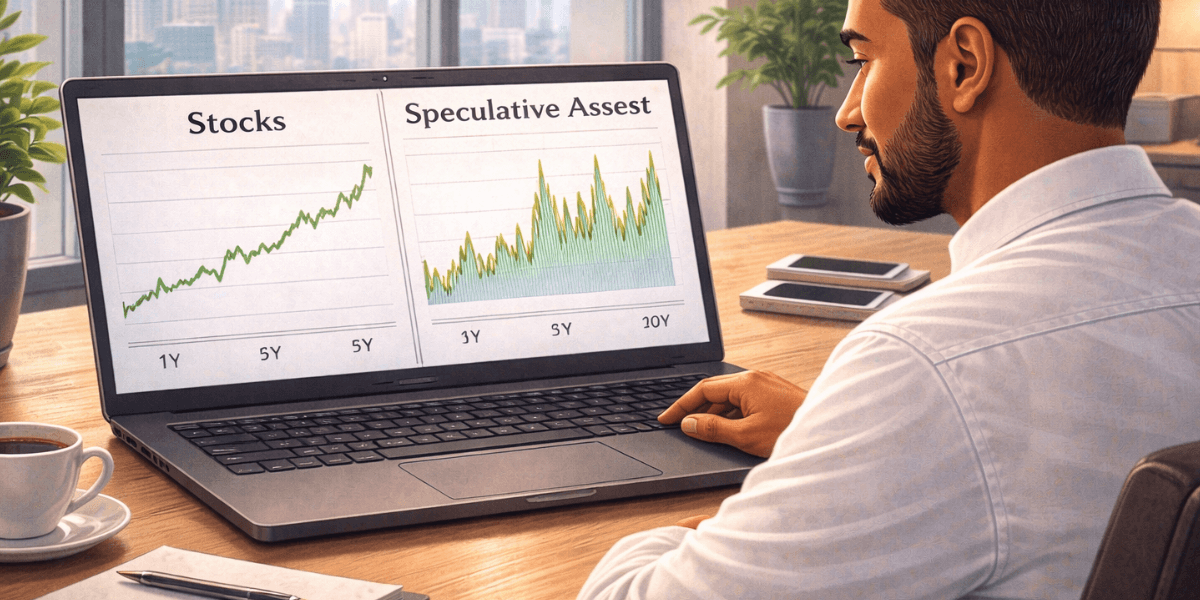
A senior-level risk analysis comparing stocks and speculative assets, explaining how permanent capital risk, time horizons, and recovery dyn...